Mason Wood
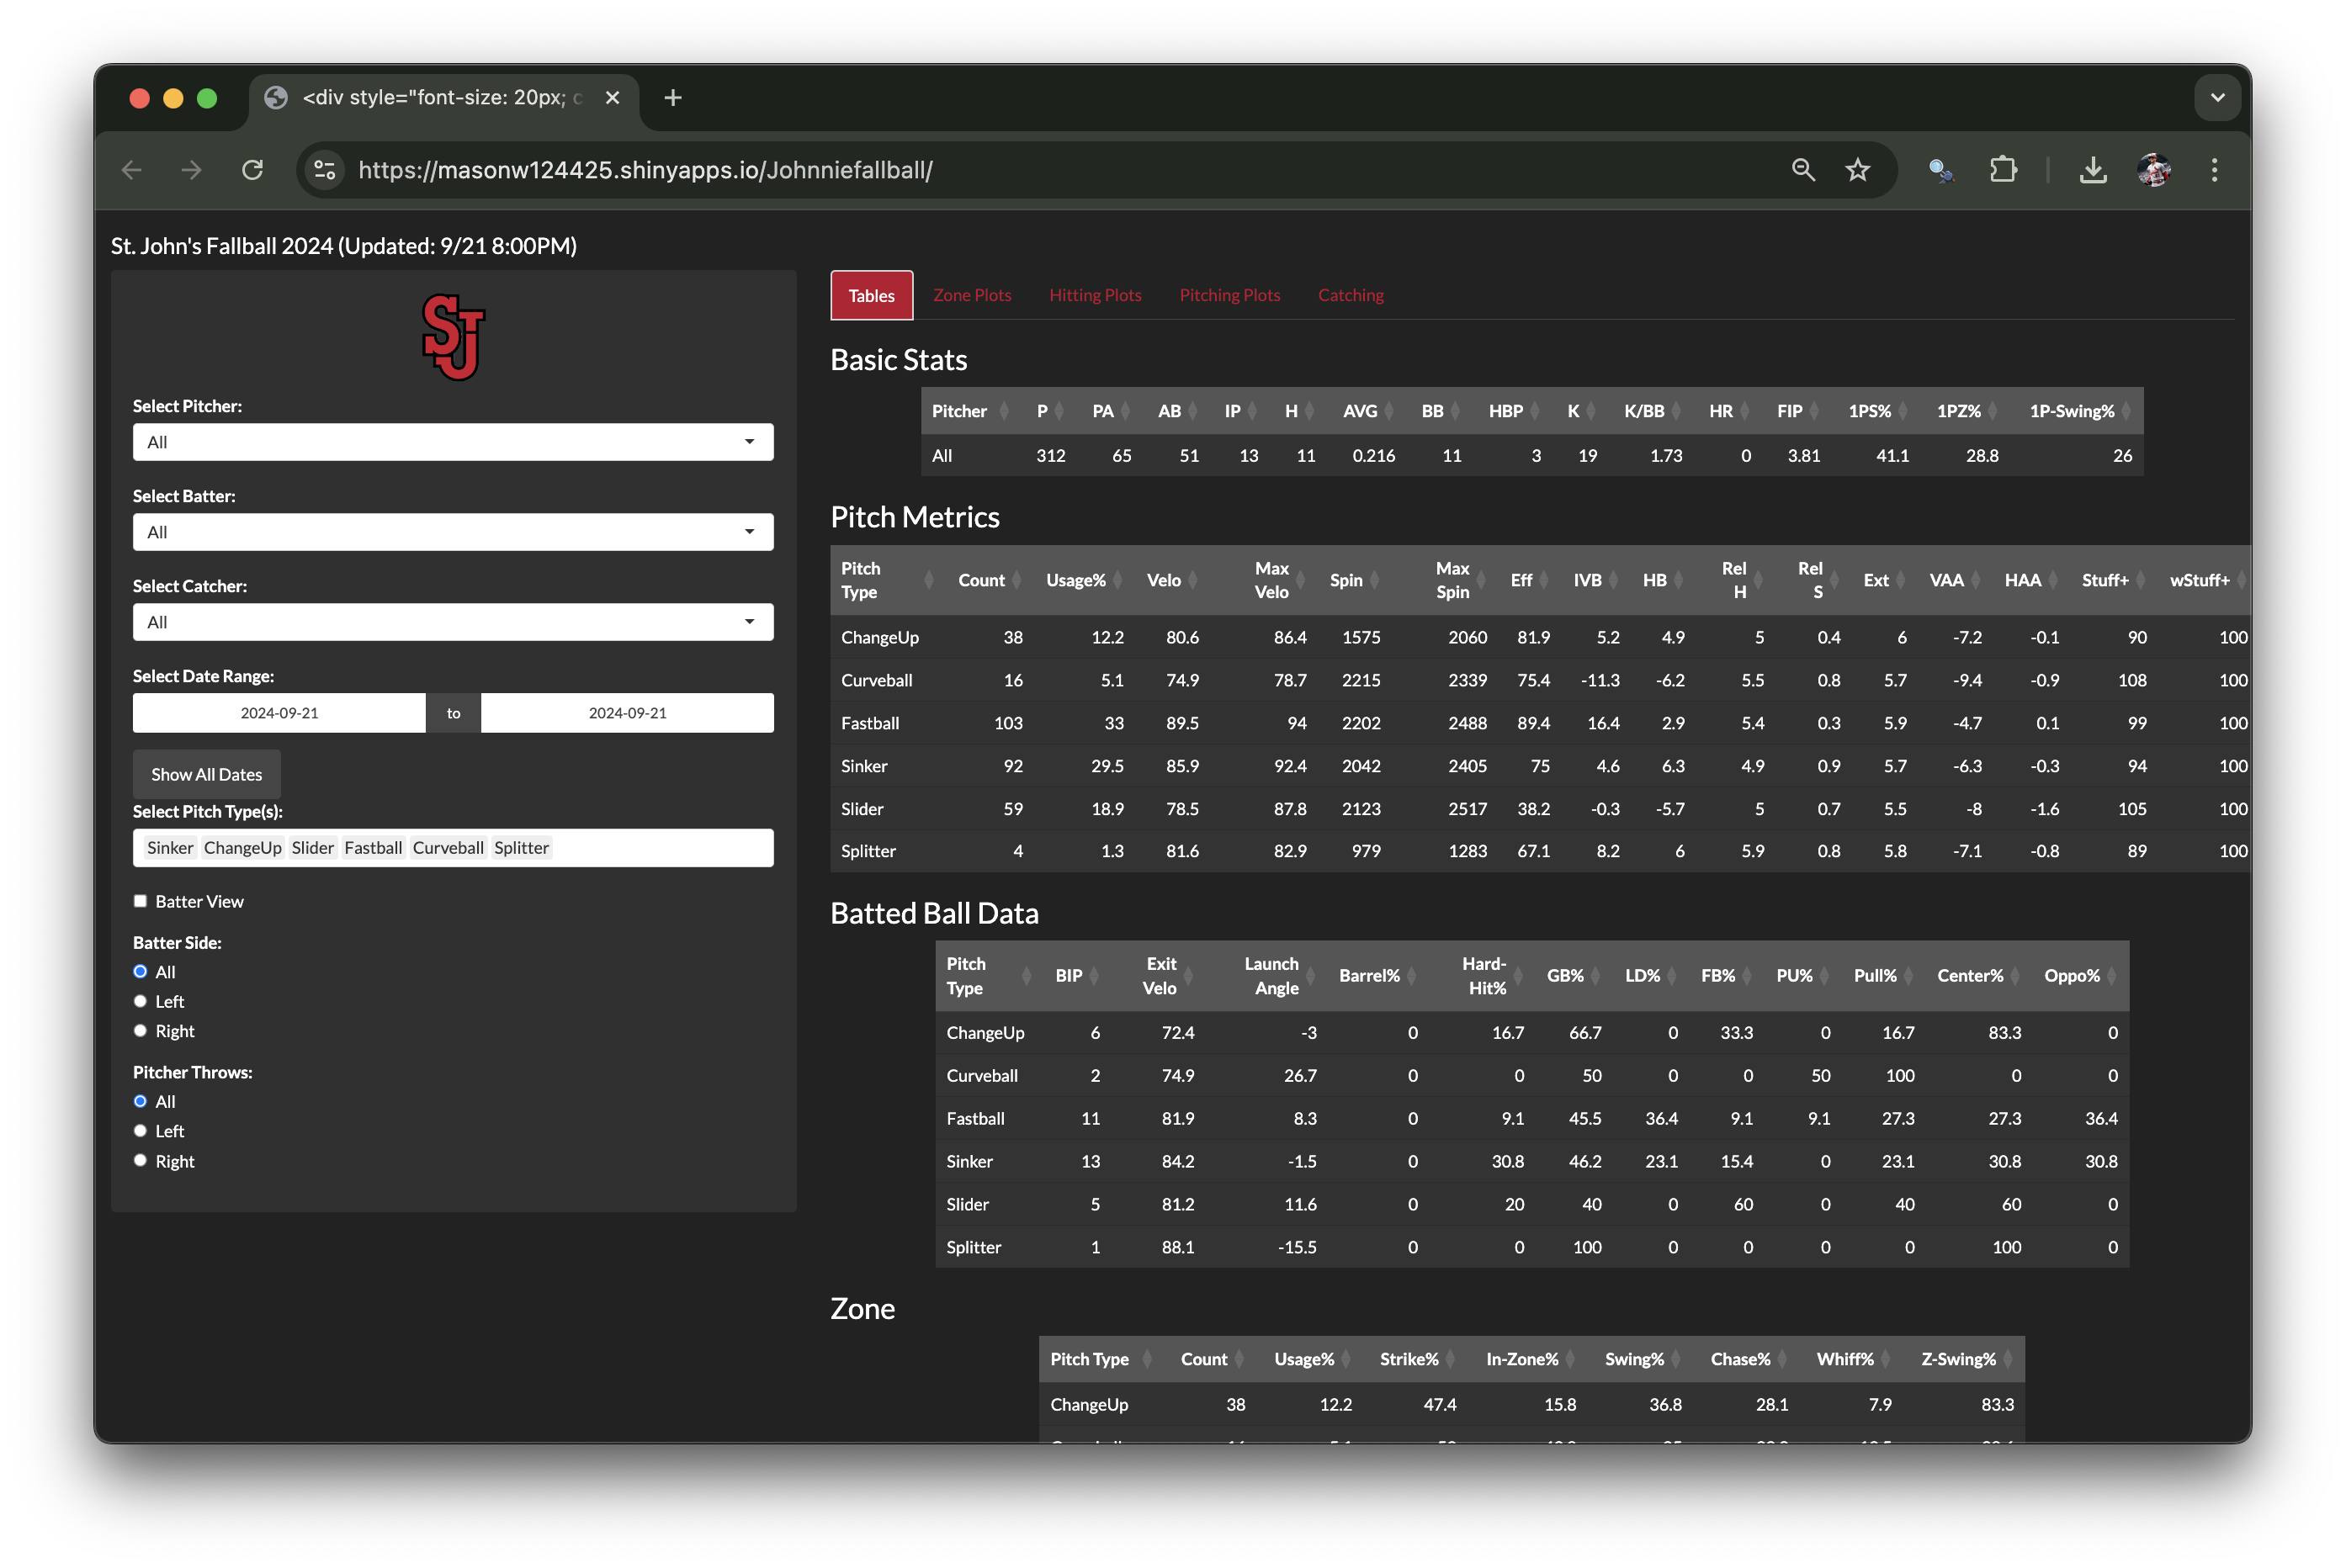
St. John's Fallball Dashboard
Created using Shiny R. Goal: Modernize intrasquad statkeeping (previously in Excel & on paper) and encourage usage of advanced analytics in the program by providing 24/7 easy access to a user friendly reactivate dashboard. Contains 170 columns of raw data on every single pitch from Trackman + 20 engineered columns. Five tabs that all serve unique purposes in aiding player development and evaluation. Filters allow for more specific statistics and graphs.
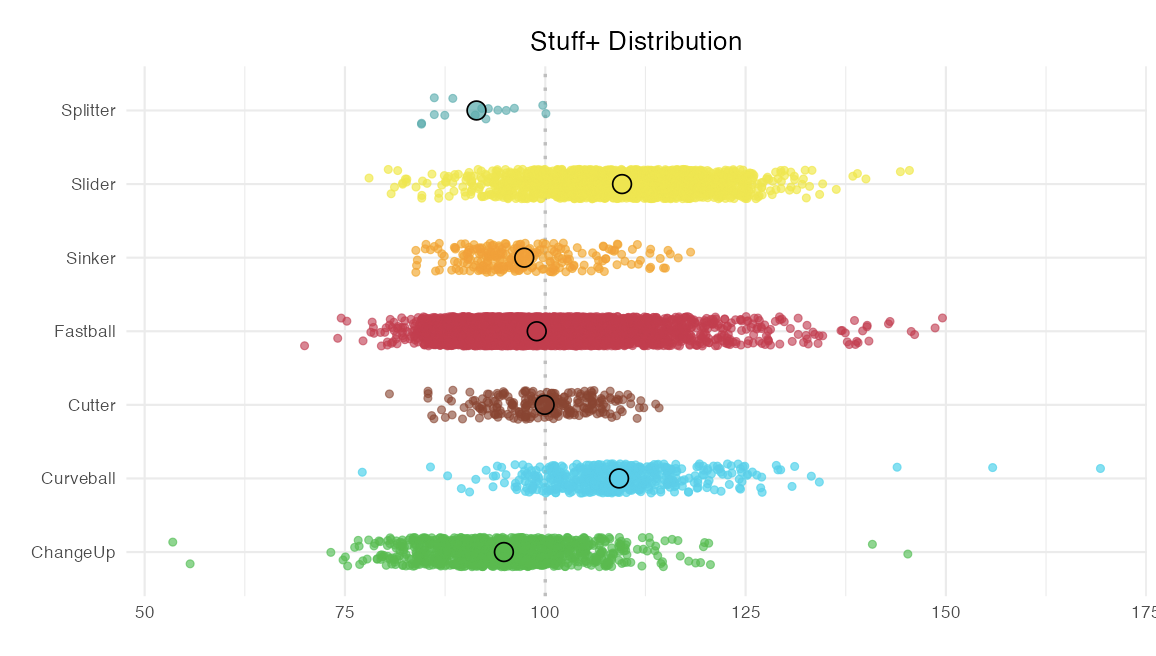
Stuff+ Model
XGBoost machine learning model used to calculate the expected CSW% (Called Strikes + Whiffs) of a pitch. The results are then scaled so that the average pitch has a score of 100, with a standard deviation of 10, which reflects the 'nastiness' of the pitch. The model was trained on features: Release Speed, Spin Rate, Release Height/Side, Extension, Induced Vertical/Horizontal Break, and Pitcher/Batter Side with 2.5M+ pitches from the 2023 & 2024 collegiate baseball seasons. Stuff+ is independent of outcome, and predictive of future success.
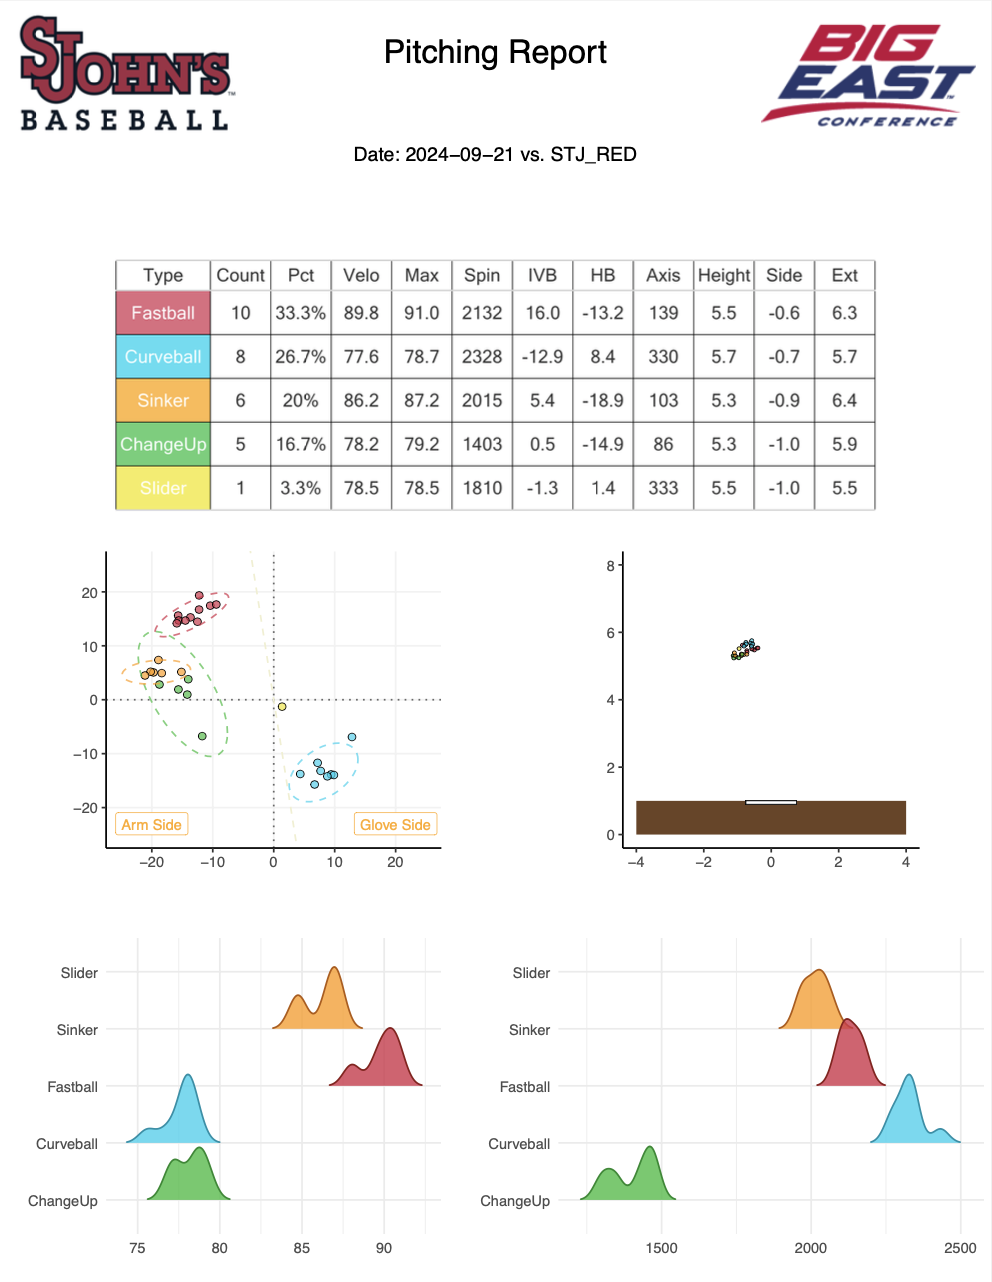
2024 Pitcher Post Game Report
Fourth iteration. Printable and instantly available after every pitcher outing, five pages of tables and graphs examining pitcher preformance. Included stats are more elementary and can be understood by anyone. Allows pitcher to review their preformance and specific successes/failures.
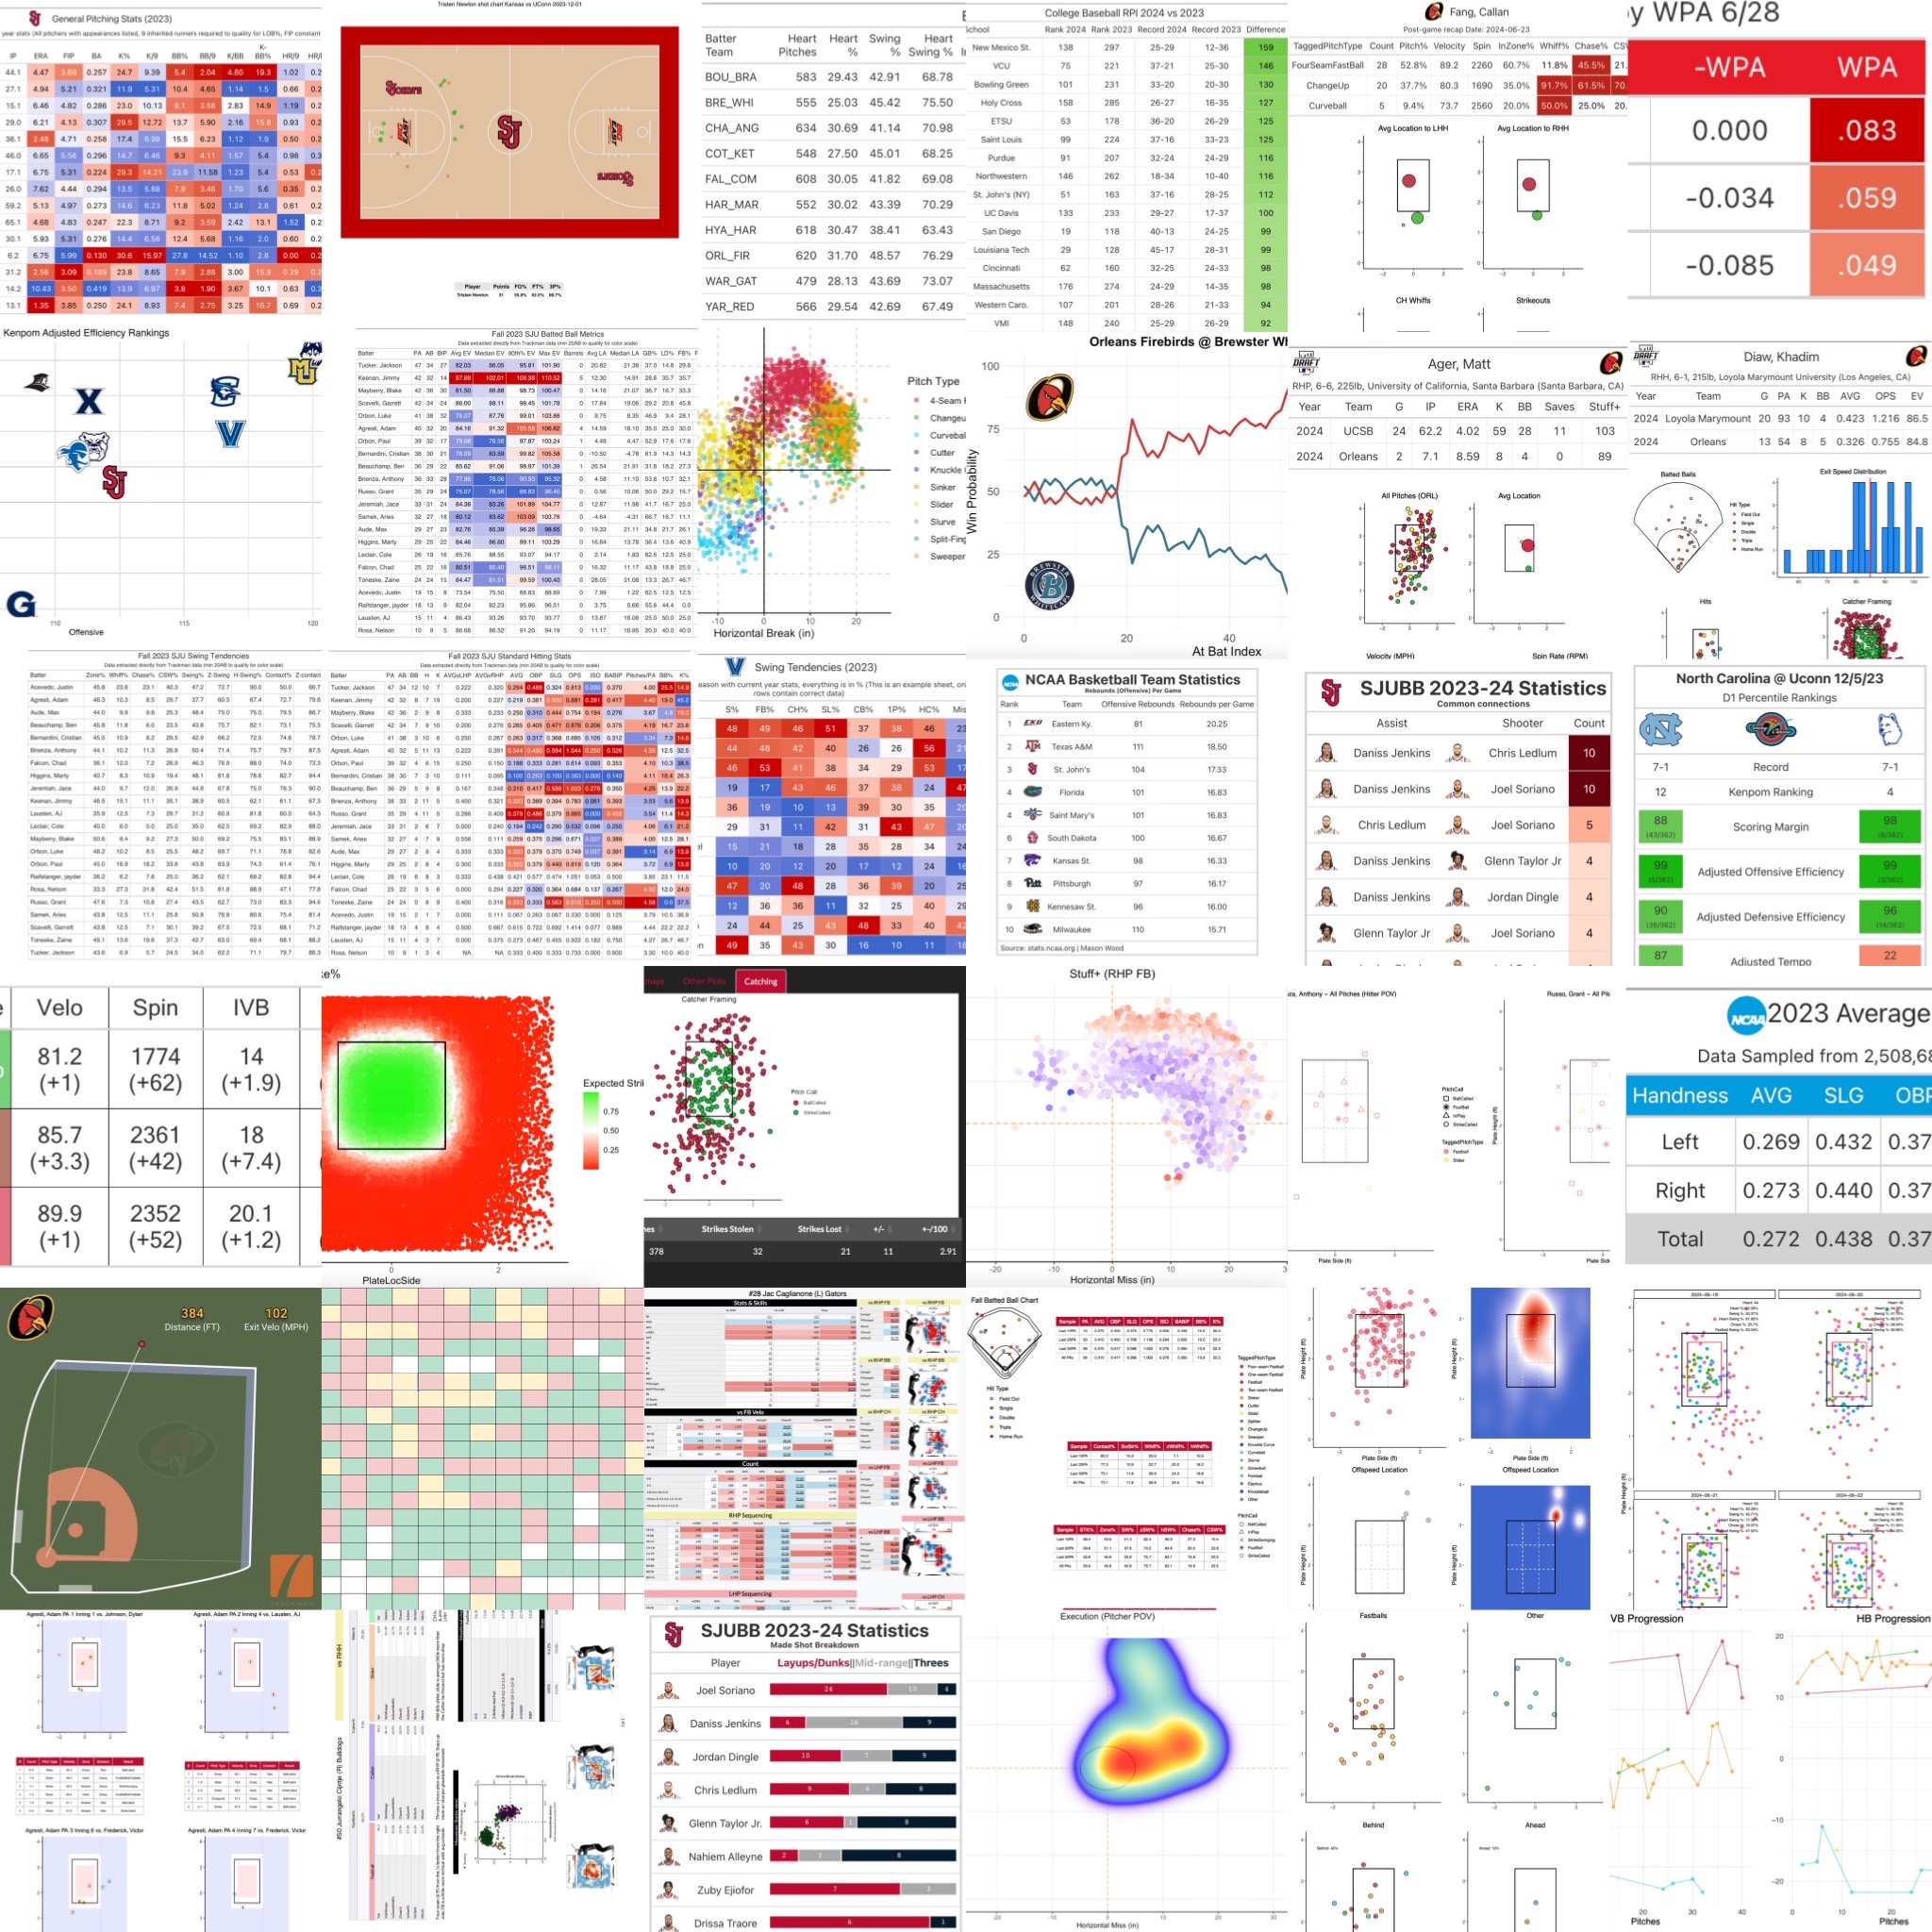
100's of Other Reports and Visuals
- Post Game Hitter Report
- Pitch Execution Tracking
- Pitcher & Hitter Draft Cards
- xCS/xBA Machiene Learning Models
- Matchup Decision Matrix
- Custom TruMedia Reports
Excited to finally put together a portfolio and showcase some of my work over the past few years. Some projects were for fun & others served a purpose, but every one was a learning experience.